Blog
Easy Waves, Bode Plots, and More
CEE connects your computer to the world of analog circuits, sensors, actuators, and anything that deals with voltage and current. That means its possibilities are significantly defined by software. Today, we're releasing new software to make your CEE an even more effective tool for your exploration and experimentation.
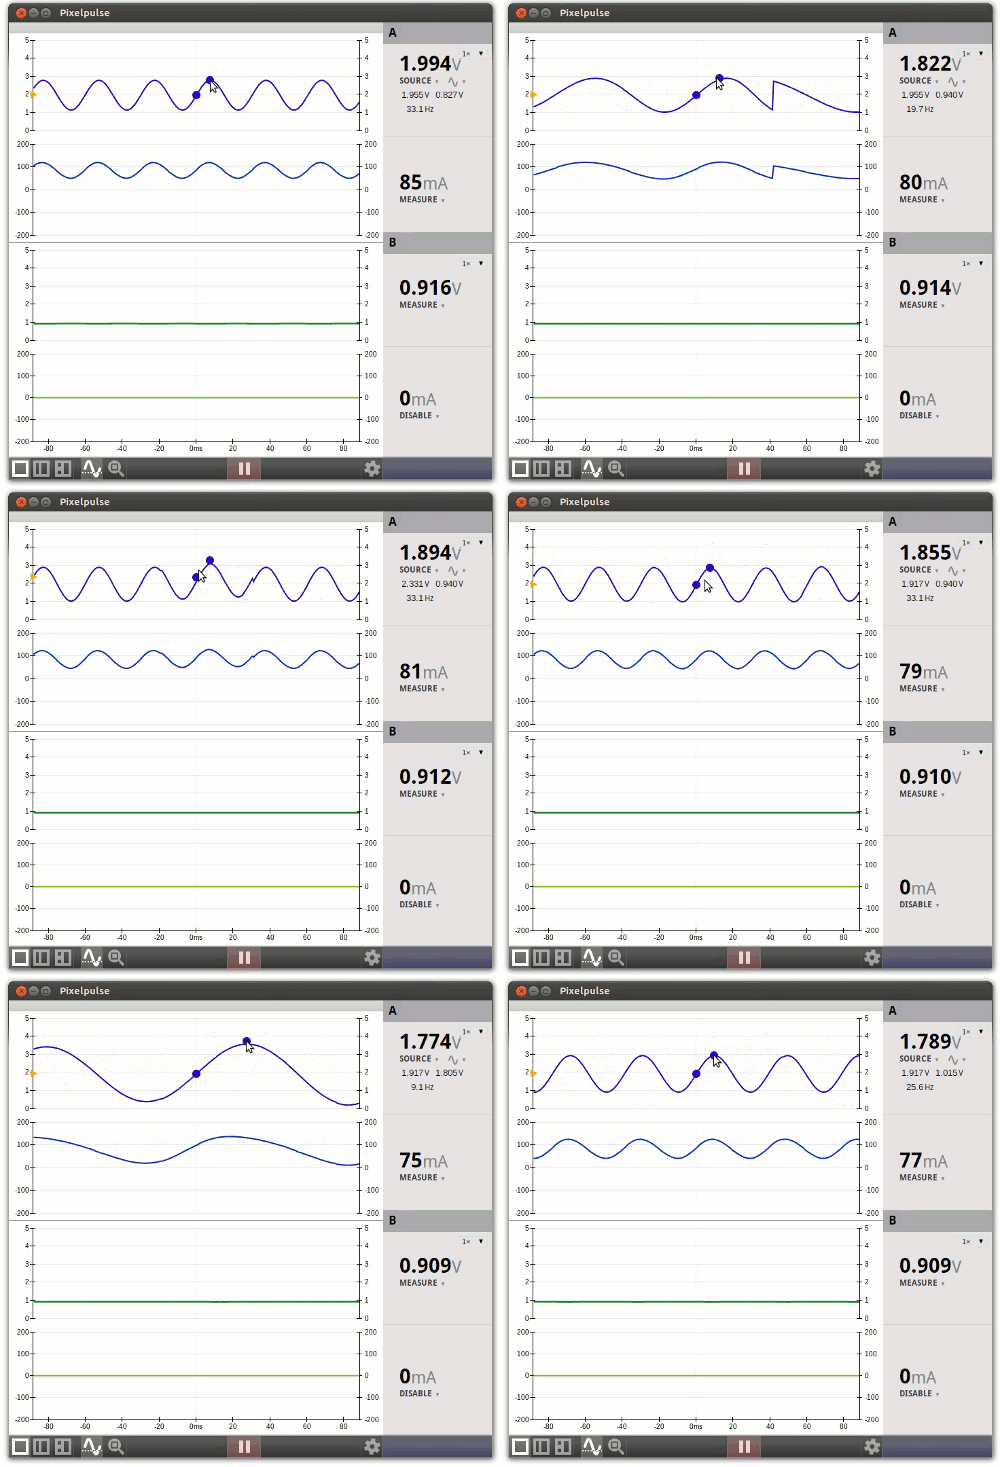
We added an entirely new way of sourcing sine, square, and triangle waves in Pixelpulse. With CEE, you can source a voltage or current wave and instantly see how the connected system responds in both variables. Tightly-coupled source/measure and in-context manipulation give CEE the most intuitive waveform generator interface available anywhere.

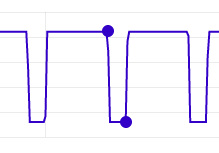
Along with this, it's now possible to adjust the duty-cycle of square waves.

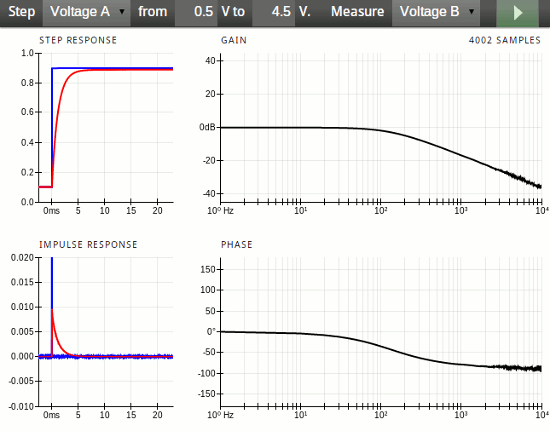
Pixelpulse works great for time-domain exploration, but we also want to see what our circuits do in the frequency domain. We've added an entirely new Dynamic Signal Analyzer tool that automatically generates a Bode Plot of the attached circuitry. A Bode Plot shows how a linear system responds at different frequencies.
Here we try it on a RC low-pass filter. You can see that it allows low-frequency components through, but higher-frequency components are strongly attenuated.

Another highly-requested feature now available is easier data export. Click the export button in the Pixelpulse toolbar to download a snapshot of the current view as CSV for use in your favorite spreadsheet software or programming language.

We're also releasing Nonolith Connect 1.3 today, fixing a few bugs. Some of these new features depend on Connect 1.3 as well as the recently-released CEE firmware 1.2, so you'll want both of these free and fast updates.
CEE and Pixelpulse are entirely open source. Check out the code on GitHub.
Don't have a CEE yet? Buy one now at the special sale price of $129.99.